GPT-6 Astra Is Climbing, but Token Volume Is Not a Quality Score

The easiest way to misuse an LLM leaderboard is to treat every upward arrow as an intelligence upgrade. This week’s OpenRouter chart offers a cleaner lesson: GPT-6 Astra is attracting real workloads, but the leaderboard still cannot tell us whether those workloads are succeeding.
Astra climbed two places, from 16th to 14th, after processing 1.65 trillion tokens in OpenRouter’s trailing seven-day window. That is up from 1.52 trillion in the previous daily snapshot. The chart also displays a 131% week-over-week change, although the extracted data does not preserve the direction glyph, so the defensible claim is the one the underlying volumes support: Astra’s routed usage is rising, and quickly enough to pass both Solar Pro 4 and GLM 5.2.
That is meaningful adoption evidence. It is not a quality verdict. OpenRouter counts prompt and completion tokens, aggregates by UTC day, excludes private traffic, and sees only requests routed through its own service. A trillion tokens can represent a large number of short customer-support calls, a smaller number of context-heavy coding agents, synthetic-data jobs, evaluation sweeps, or verbose completions that did not help anybody. The unit being ranked is consumption, not successful tasks.
Astra’s promotion is a reason to test, not migrate
The scale makes Astra difficult to dismiss as launch-day tourism. A model does not casually accumulate 1.65 trillion routed tokens in a week. Developers are at least putting it into evaluations, agents, batch jobs, or production paths. Passing two established models also suggests this is more than curiosity around a demo.
But rank compresses several unrelated forces into one number. Pricing can shift traffic overnight. A generous free allowance can turn an experimental agent loop into billions of tokens. Context windows reward models used for document processing, while verbose reasoning modes can inflate completion counts. Integrations, regional availability, rate limits, cache discounts, and router defaults all affect consumption before answer quality enters the discussion.
This is the first useful distinction for engineering teams: adoption answers “what are people trying?” Quality answers “which system performs our task reliably?” A model can win the first question through economics and lose the second through retries, invalid JSON, missed tool calls, or latency spikes. Conversely, a model with modest public routing volume may be dominant through provider-direct APIs that OpenRouter never sees.
The top of the table makes the same point at larger scale. GPT-5.6 Luna remains first with 15.2 trillion weekly tokens, while DeepSeek V4.1 Flash is second with 12.9 trillion. Yet the gap narrowed from 4.0 trillion to 2.3 trillion between rolling snapshots: Luna fell from 15.8 trillion while DeepSeek rose from 11.8 trillion. That is a substantial swing, but it is not a clean daily flow measurement. A seven-day window changes when one day enters and another leaves, so adjacent snapshots can reflect an unusually large historical day rolling off as much as fresh demand rolling in.
The most revealing race is happening around eighth place
NVIDIA’s Nemotron 3 Ultra (free) reached 3.98 trillion tokens and moved from ninth to eighth, edging DeepSeek V4 Flash 0423 at 3.95 trillion. The difference is roughly 30 billion tokens—huge in absolute terms, but less than one percent of either model’s weekly total. The correct reading is “effectively tied,” not “Nemotron defeats DeepSeek.”
The parenthetical “free” may explain as much as the model architecture. At near-zero marginal cost, teams can route extraction, classification, synthetic-data generation, and disposable agent work at a scale they would never approve at premium prices. That does not invalidate the demand. Cost is a feature, and a model that makes a previously uneconomic workload possible has created genuine value. It does mean token share is partly a market-clearing price signal.
There is also a second-order effect that rankings hide: retries. A cheap model that needs three attempts to produce valid structured output may log more tokens than an expensive model that succeeds once. The leaderboard rewards all four generations equally. An engineering dashboard should not. Useful internal metrics include accepted outputs per dollar, valid tool calls per thousand requests, p50 and p95 latency, retry rate, human escalation rate, and task completion under a fixed budget.
Claude Sonnet 5 supplies another warning about ordinal movement. It fell two places, from 15th to 17th, while its volume stayed almost flat—about 1.53 trillion tokens versus 1.52 trillion in the prior snapshot. Sonnet did not collapse; faster-growing models passed it. Rank alone makes stable demand look like retreat.
Arena’s stillness is not a contradiction
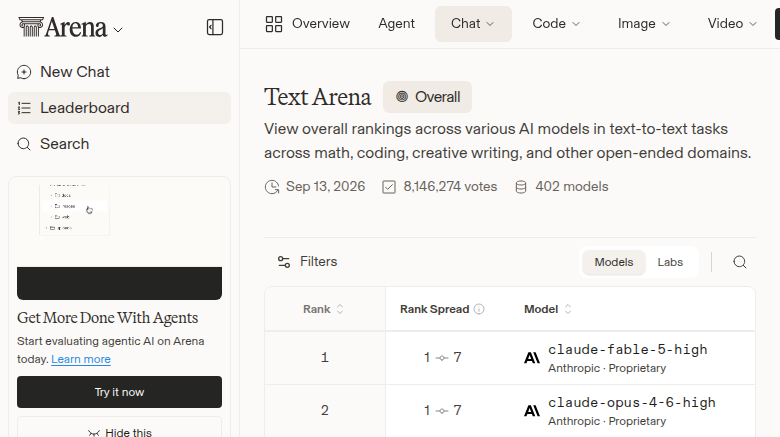
Arena’s rendered Overall top 20 did not change. Its first five remain claude-fable-5, claude-opus-4-6-high, claude-opus-4-7-high, muse-spark-1.2 (xHigh), and claude-fable-5.1-max. The accessible page did not provide auditable Elo scores or vote counts for this run, so inventing precision would be worse than leaving those values unstated.
The stable Arena table and moving OpenRouter chart measure different systems. Arena asks users to choose between paired answers, approximating human preference under its prompt distribution. OpenRouter records routed token consumption, reflecting availability, price, workload shape, and developer behavior. One can stay still while the other moves without either being wrong.
In fact, disagreement is useful. If a model rises in usage before it rises in preference, developers may have discovered a cost or operational advantage that chat voting misses. If preference improves before deployment volume follows, integration friction or pricing may be holding adoption back. If both rise for several consecutive windows, the case for deeper evaluation becomes stronger. No single chart deserves veto power over an architecture decision.
Build the bake-off around your failures
Teams curious about Astra or Nemotron should avoid a generic chatbot beauty contest. Pull a stratified sample of production-shaped prompts, including the ugly cases: long contexts, ambiguous instructions, malformed inputs, tool failures, and outputs that must validate against a schema. Pin model versions where possible and run the same harness across candidates.
Score business outcomes, not prose vibes. For a coding agent, track tests passed, regressions introduced, tool-call errors, wall-clock completion time, and human correction minutes. For extraction, measure field-level accuracy, schema validity, abstention behavior, and cost per accepted record. For support, include policy compliance and escalation quality. A small, representative evaluation with clear acceptance thresholds beats a global rank assembled from somebody else’s workloads.
Keep the routing layer reversible as well. Put model identifiers behind an application-owned alias, retain a rollback path, and shadow a slice of traffic where privacy policy allows. Log the model version, price, latency, token counts, cache behavior, and retry chain for each request. Otherwise the next leaderboard move will tempt the team into a migration it cannot evaluate—or undo cleanly.
The practical conclusion is deliberately narrow. Astra has gained substantial routed usage, enough to warrant a serious internal test. Nemotron and DeepSeek are in a near tie that says as much about economics as capability. Arena supplies no matching preference reshuffle, and OpenRouter omits provider-direct and private traffic. The market is experimenting, not delivering a final answer.
Leaderboards are best used as candidate generators. Let them decide what enters the bake-off, never what leaves production. A seven-day token chart can reveal momentum; only your own instrumentation can reveal whether that momentum ships value.
Sources: OpenRouter AI Model Rankings, LMArena Leaderboard, OpenRouter Models API, OpenRouter documentation