Claude Opus 5 Didn’t Move. Its Usage Jumped 610 Billion Tokens.

The most important move in this week’s model rankings is the one that did not happen. Claude Opus 5 stayed at number eight on OpenRouter, yet its rolling weekly volume jumped from 2.06 trillion to 2.67 trillion tokens between daily snapshots. That is 610 billion additional tokens, or 29.6%, without gaining a single place.
Benchmark-watchers will be tempted to treat that as an awkward footnote. It is closer to the main story. The market for frontier models is beginning to separate “expensive on the price sheet” from “expensive in an actual system,” and the difference is being made by prompt caching, provider competition, and routing that can survive an endpoint having a bad day.
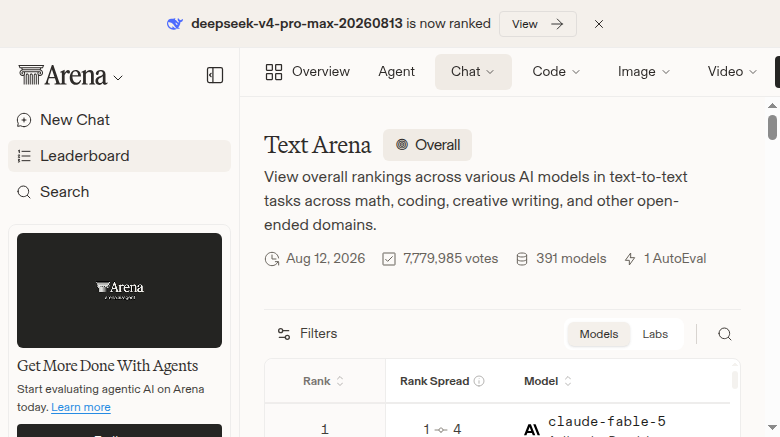
The public rankings themselves were mostly static. Arena’s extracted overall top 20 did not change: Anthropic models occupy six of the first nine slots, led by Claude Fable 5, while Meta’s Muse Spark variants, Alibaba’s Qwen 3.8 Max, Google’s Gemini family, and OpenAI’s GPT-5.5 and GPT-5.6 models fill much of the rest. Arena’s page showed 7,779,985 votes and 391 models when captured, but its current page structure did not expose sufficiently trustworthy Elo values for this report. Inventing precision because a table looks incomplete is how benchmark coverage turns into numerology.
OpenRouter had one minor swap: Gemini 3.6 Flash rose from tenth to ninth, passing Nvidia’s free Nemotron 3 Ultra. DeepSeek V4 Flash 0731 remains first with 11.2 trillion weekly tokens. Tencent Hy3 is second at 9.95 trillion, down from 10.4 trillion in the prior snapshot, widening DeepSeek’s lead from 700 billion to 1.25 trillion tokens. No model entered or left either extracted top 20.
Sticker price is losing the argument to effective price
Claude Opus 5 launched on July 24 with a one-million-token context window and list pricing of $5 per million input tokens and $25 per million output tokens. Those numbers make it easy to dismiss the model for high-volume agents. OpenRouter’s telemetry tells a more useful story: its weighted average effective input price is $1.294 per million tokens, roughly 74% below list.
The gap is not magic and it is not a permanent discount. It is largely the product of cache reuse. Provider-level cache hit rates on the model page range from about 60% to 87.5%, and the three largest one-day routes each report hit rates above 84%. A coding agent repeatedly sending repository context, system instructions, tool schemas, and an accumulating work log is an unusually good caching workload. The model can remain expensive for fresh tokens while becoming much cheaper for the stable prefix that dominates a long agent session.
This is the first practical lesson for engineering teams: token price is no longer a scalar. Cost depends on the shape of the trace. Two applications can send the same total number of input tokens and receive radically different bills if one preserves stable prompt prefixes and the other constantly reshuffles context. Teams should measure cache writes, cache reads, uncached input, output, reasoning tokens, and retries separately. OpenRouter says each API response exposes native-tokenizer prompt and completion counts, cost, reasoning tokens, and cached-token counts, so this is measurable per request rather than a budgeting exercise performed with a model-card calculator.
There is a less flattering interpretation of the volume, too. At the captured activity snapshot, Opus 5 recorded 126 billion prompt tokens against 1.04 billion completion tokens and 1.23 billion reasoning tokens. A one-million-token context window makes it possible to consume enormous volumes without producing proportionally more useful work. Rankings based on tokens reward appetite. They do not tell us whether a patch passed CI, a support case was resolved, or an analyst found the right answer.
The workload is agentic, and concentrated
The application mix is more revealing than the rank. Claude Code accounts for 757 billion Opus 5 tokens on OpenRouter, followed by Hermes Agent at 266 billion, Framer at 86.7 billion, OpenClaw at 68.6 billion, and Cline at 63.9 billion. Together those five account for roughly 1.24 trillion tokens. That is observable production traffic from coding and autonomous-agent tools, not a survey asking developers which logo they prefer.
It is still not proof of quality. Usage can be moved by a default-model change, a promotion, or a handful of very large customers. A rolling weekly leaderboard also means adjacent daily snapshots overlap heavily. The 102% growth displayed beside Opus 5 is a signal worth following, not evidence that every team should migrate before lunch.
What it does suggest is that frontier-model adoption is increasingly decided above the model layer. Artificial Analysis metrics reproduced on the OpenRouter page put Opus 5 at 63.1 on its Intelligence Index, 78.0 on Coding, 59.2 on Agentic tasks, 93.2% on GPQA Diamond, and 54.9% on Humanity’s Last Exam. Those scores establish capability. They do not explain why a product can afford to send hundreds of billions of tokens. The delivery system does.
Routing is part of model quality now
Opus 5 traffic is spread across infrastructure rather than pinned to one endpoint. Claude Platform on AWS (2) handles 48.3% of one-day token share, Amazon Bedrock 27.8%, and Anthropic 14.8%, with other routes carrying the remainder. OpenRouter lists ten routes spanning Anthropic, AWS, Azure, and Google infrastructure. Its best-provider median throughput is 76 tokens per second, median latency is 1.69 seconds, three-day uptime is 100%, and measured availability is 99.75%.
The sharper number is routed availability: 99.76%, compared with 86.75% “without routing” during the measurement window. A 13-point gap matters more than a one-place leaderboard move. Long-running agents amplify reliability problems because a failure near the end of a tool loop can waste minutes of compute, repeated context, and human attention. Availability is not merely an infrastructure metric; it changes cost per completed task.
Multi-provider routing also creates a trap. Providers can differ in time to first token, structured-output behavior, tool-call reliability, cache semantics, and content filtering. Automatic failover improves the probability that a request finishes, but it can quietly reduce reproducibility. Pin the provider and model version for evaluations, regulated workflows, and bugs you need to replay. Allow failover for interactive or batch work where completing the job matters more than reproducing every token. “Use routing” is not a complete architecture decision; the failure policy belongs in the product specification.
For teams evaluating Opus 5, the right test is a shadow run on real traces. Compare it with a cheaper model on identical coding-agent sessions and record accepted-task rate, wall-clock time, repair loops, tool errors, cache-hit rate, provider failovers, and dollars per accepted change. Keep repository context stable enough to exercise caching, but do not manufacture an unrealistically favorable prompt. If the premium model closes materially more issues or avoids expensive retries, its list price is misleading. If it only absorbs larger contexts while success stays flat, the ranking is measuring consumption rather than productivity.
DeepSeek still owns the volume crown, Arena still favors Anthropic at the top, and Gemini’s one-place gain is too small to support a grand theory. The durable shift is elsewhere: the model is becoming one component in a performance envelope built from caching, routing, telemetry, and failure recovery. Opus 5’s stationary rank and surging traffic make that visible. The next useful leaderboard will rank systems by cost per successful outcome. Until then, engineers should treat token charts as workload clues—not purchasing instructions.
Sources: OpenRouter Rankings, Claude Opus 5 model telemetry, OpenRouter usage accounting documentation, OpenRouter provider-routing documentation, Arena AI Text Leaderboard