GLM’s 2.79-Trillion-Token Surge Is a Bake-Off Signal, Not a Crown

The most useful model leaderboard result this week is a disagreement. Z.ai's GLM 5.3 family is suddenly carrying serious traffic through OpenRouter, while its flagship Arena entry moved backward in human preference. That is not a contradiction to explain away. It is exactly the kind of split signal engineering teams should want, because usage and quality answer different questions—and confusing them is how a promising bake-off candidate becomes an expensive production mistake.
GLM 5.3 Flash entered OpenRouter's weekly top 20 at number 11 with 1.74 trillion tokens. The standard GLM 5.3 reached number 18 on 1.05 trillion tokens after growing 507% week over week. Combined, the two variants processed 2.79 trillion tokens in the seven-day window through August 27. One launch-week spike can be a promotion, a free tier, a routing default, or a single unusually large customer. Two related variants rising at once is harder to dismiss as random leaderboard churn.
But it is still not a quality win. OpenRouter ranks models by prompt and completion tokens routed through its API, excludes private requests, and counts free and paid variants separately. A token is not a user, a request, a dollar of revenue, or a successful task. Models also tokenize and elaborate differently: a verbose model can generate more leaderboard volume while completing fewer useful jobs. Treating 2.79 trillion tokens as market share would be like treating database bytes written as customer satisfaction.
Adoption can rise while preference falls
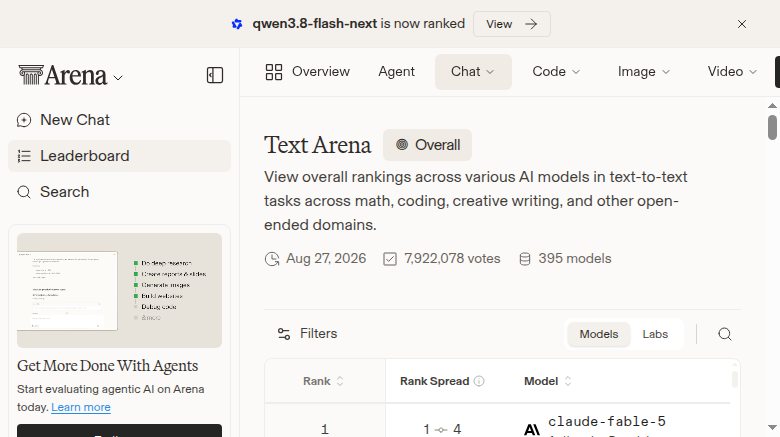
Arena supplies the counterexample. Its top 12 remained unchanged, and GLM 5.3 Max recorded the largest move in the lower half of the table: down two places, from number 13 to number 15. Arena's ranking is built from pairwise user preferences, with reweighting for models that have fewer battles and closed-form confidence intervals. The current table exposes ordinal and category ranks rather than fresh Elo scores or vote totals, so inventing precision here would be dishonest. The defensible statement is narrower: GLM attracted sharply more routed workload at the same time its Max variant became slightly less preferred in Arena's prompt mix.
That divergence suggests at least three plausible stories. First, buyers may be optimizing for economics rather than maximum perceived answer quality. A fast or inexpensive model that is “good enough” can win production traffic while losing head-to-head beauty contests. Second, the workloads may be different: Arena emphasizes anonymous interactive comparisons, while OpenRouter sees API traffic that may include extraction, classification, synthetic-data generation, and other high-volume tasks where consistency matters more than conversational polish. Third, launch incentives or automated routing could be accelerating trials before teams have completed their evaluations. The public data cannot distinguish among those explanations, but each implies a different production decision.
The surrounding rankings reinforce how unstable a single position can be. Nvidia's free Nemotron 3 Ultra rose to number five on 5.52 trillion tokens, passing DeepSeek V4 Flash 0423 at 5.49 trillion. The gap is only 30 billion tokens—roughly 0.5% of Nemotron's volume—so the rank change is less meaningful than the headline number suggests. Elsewhere, Nemotron 3.5 Lightning grew 23% yet fell two places to number 19 because competitors grew faster. Rankings are relative coordinates, not measurements of intrinsic improvement.
Even the top of OpenRouter deserves the same caution. Ox Alpha remained number one at 27.2 trillion weekly tokens, more than twice DeepSeek V4 Flash 0731 at 12.5 trillion, with displayed growth above 999%. That is an enormous routing event, not a self-explanatory product verdict. Percentage growth without a base rate is particularly treacherous; traffic can multiply quickly from a small starting point, and a single high-throughput integration can dominate a token chart without representing broad adoption.
Put GLM in the bake-off, not on the throne
For practitioners, the rankings have done their job once they nominate GLM 5.3 Flash for evaluation. The next step is not migration. Add it to the same task-specific harness used for current providers and replay representative production traces, including the ugly tail: malformed inputs, long contexts, empty retrieval results, tool failures, schema edge cases, and requests that should be refused. A clean demo prompt mostly measures whether the demo was clean.
Record answer acceptance, not just a generic judge score. Pair it with time to first token, end-to-end latency, input and output tokens, cost per accepted result, structured-output validity, tool-call success, retry rate, and p95 behavior. If a model is 30% cheaper per token but needs longer answers or more retries, its apparent advantage can disappear at the workflow level. Conversely, a modest preference gap may not matter if Flash reliably completes a narrow task with lower latency and a meaningfully better cost envelope.
Run the evaluation blind where possible, stratify results by task type, and inspect disagreements rather than averaging them away. A single aggregate score can conceal a model that excels at extraction but fails at planning, or that writes attractive prose while quietly violating JSON schemas. For agentic systems, separately test argument construction, tool selection, recovery after tool errors, and whether the model stops when the task is complete. These are production behaviors that neither token throughput nor anonymous pairwise voting directly captures.
If GLM clears the offline bar, use a routing flag and begin with shadow traffic or a small canary. Keep provider fallback available, cap spend, and watch accepted-result cost alongside latency and error budgets. This matters especially during a launch surge: pricing, rate limits, model aliases, and serving behavior can change after promotional demand settles. The model you tested should also be the model you can identify in logs; vague aliases are convenient until an upstream revision changes behavior on Friday afternoon.
There is also a portfolio lesson in the table. Anthropic holds much of Arena's upper tier, while OpenRouter's usage list is more fragmented across stealth, DeepSeek, Xiaomi, Tencent, Nvidia, OpenAI, Google, Z.ai, MiniMax, Moonshot, Poolside, and Anthropic. Interactive preference is concentrating differently from routed workload. Teams that choose one universal model from one universal leaderboard are discarding that information. A small, observable routing layer—backed by per-task tests—is increasingly more rational than provider loyalty.
The leaderboard is a discovery surface, not a deployment policy
No high-confidence, attributable Hacker News or Reddit discussion with stable vote counts surfaced in the research window. That absence is worth stating because vendor-adjacent posts and search snippets are not community consensus. The data already supports a useful conclusion without manufacturing one: builders are sending enough work to GLM 5.3 that it now deserves attention, but the public signals do not tell us why they are doing it or whether those workloads succeed.
The sharpest reading of this week's rankings is therefore deliberately limited. GLM did not “win.” It crossed the threshold from interesting release to credible engineering candidate, and it did so while Arena reminded us that popularity of use and preference of output can move in opposite directions. Strong teams will preserve that tension: use public leaderboards to expand the test matrix, use production-shaped traces to narrow it, and let cost per accepted result—not rank, hype, or raw tokens—decide what ships.
Sources: OpenRouter LLM Rankings, Arena Text leaderboard, Arena-Rank methodology, OpenRouter Data API documentation