Argus Makes Claude Code Telemetry a Developer-Visible Surface, Not a Billing Surprise

The interesting thing about Argus is not that it shows token counts in VS Code. Token counters are the new progress bars: useful, easy to overread, and usually not the real story. The useful thing about Argus is that it treats a Claude Code session as a traceable execution, not a magic conversation. That is where coding-agent tooling has to go if developers are going to trust agents with work longer than “rename this function.”
HackerNoon’s writeup frames the problem bluntly: autonomous agents are too expensive and too opaque to leave unattended. The common failure modes are familiar to anyone who has watched a terminal agent wander into the weeds. It retries the same failed Bash command with the same bad parameters. It rereads the same files until the context window bloats. It hits compaction, loses the thread, and starts hallucinating around its own partial memory. Meanwhile the developer sees a spinner, a few tool-call snippets, and eventually a bill-shaped mystery.
Argus, an open-source VS Code extension from the yessGlory17/argus repository, attacks that failure mode by reading the JSONL transcripts Claude Code writes under ~/.claude/projects/ and turning them into a live session view. Its README and marketplace metadata describe a local, editor-first dashboard for prompts, file reads and writes, Bash calls, WebFetches, subagent calls, token usage, cache behavior, cost, performance, and dependency flow. During research, the repository had 97 GitHub stars, 6 forks, 2 open issues, and was updated on May 26, 2026. The VS Code Marketplace listing showed version 0.3.1, last updated May 8, with 121 installs and a 5.0 average rating from one rating.
Those adoption numbers are early. That is fine. The category is the story. Claude Code itself is already adding adjacent first-party signals: v2.1.149 introduced /usage breakdowns for skills, subagents, plugins, and per-MCP-server cost; v2.1.152 added large session files to /usage, corrected cache-creation token reporting, and added an optional OpenTelemetry metric attribute for app.entrypoint. When the runtime adds cost attribution and the ecosystem adds transcript debuggers, that is a sign the product has crossed from “assistant” into “operational surface.”
The transcript is the debugger
A human developer usually knows when they are thrashing. They remember opening the same file five times, rerunning the same failing test, chasing the wrong stack trace, or spending an hour on a dependency issue that turned out to be a typo in configuration. An agent can do all of that faster and quieter. If the only artifact you inspect is the final diff, you miss the process that produced it — and the process is where a lot of cost, risk, and quality loss lives.
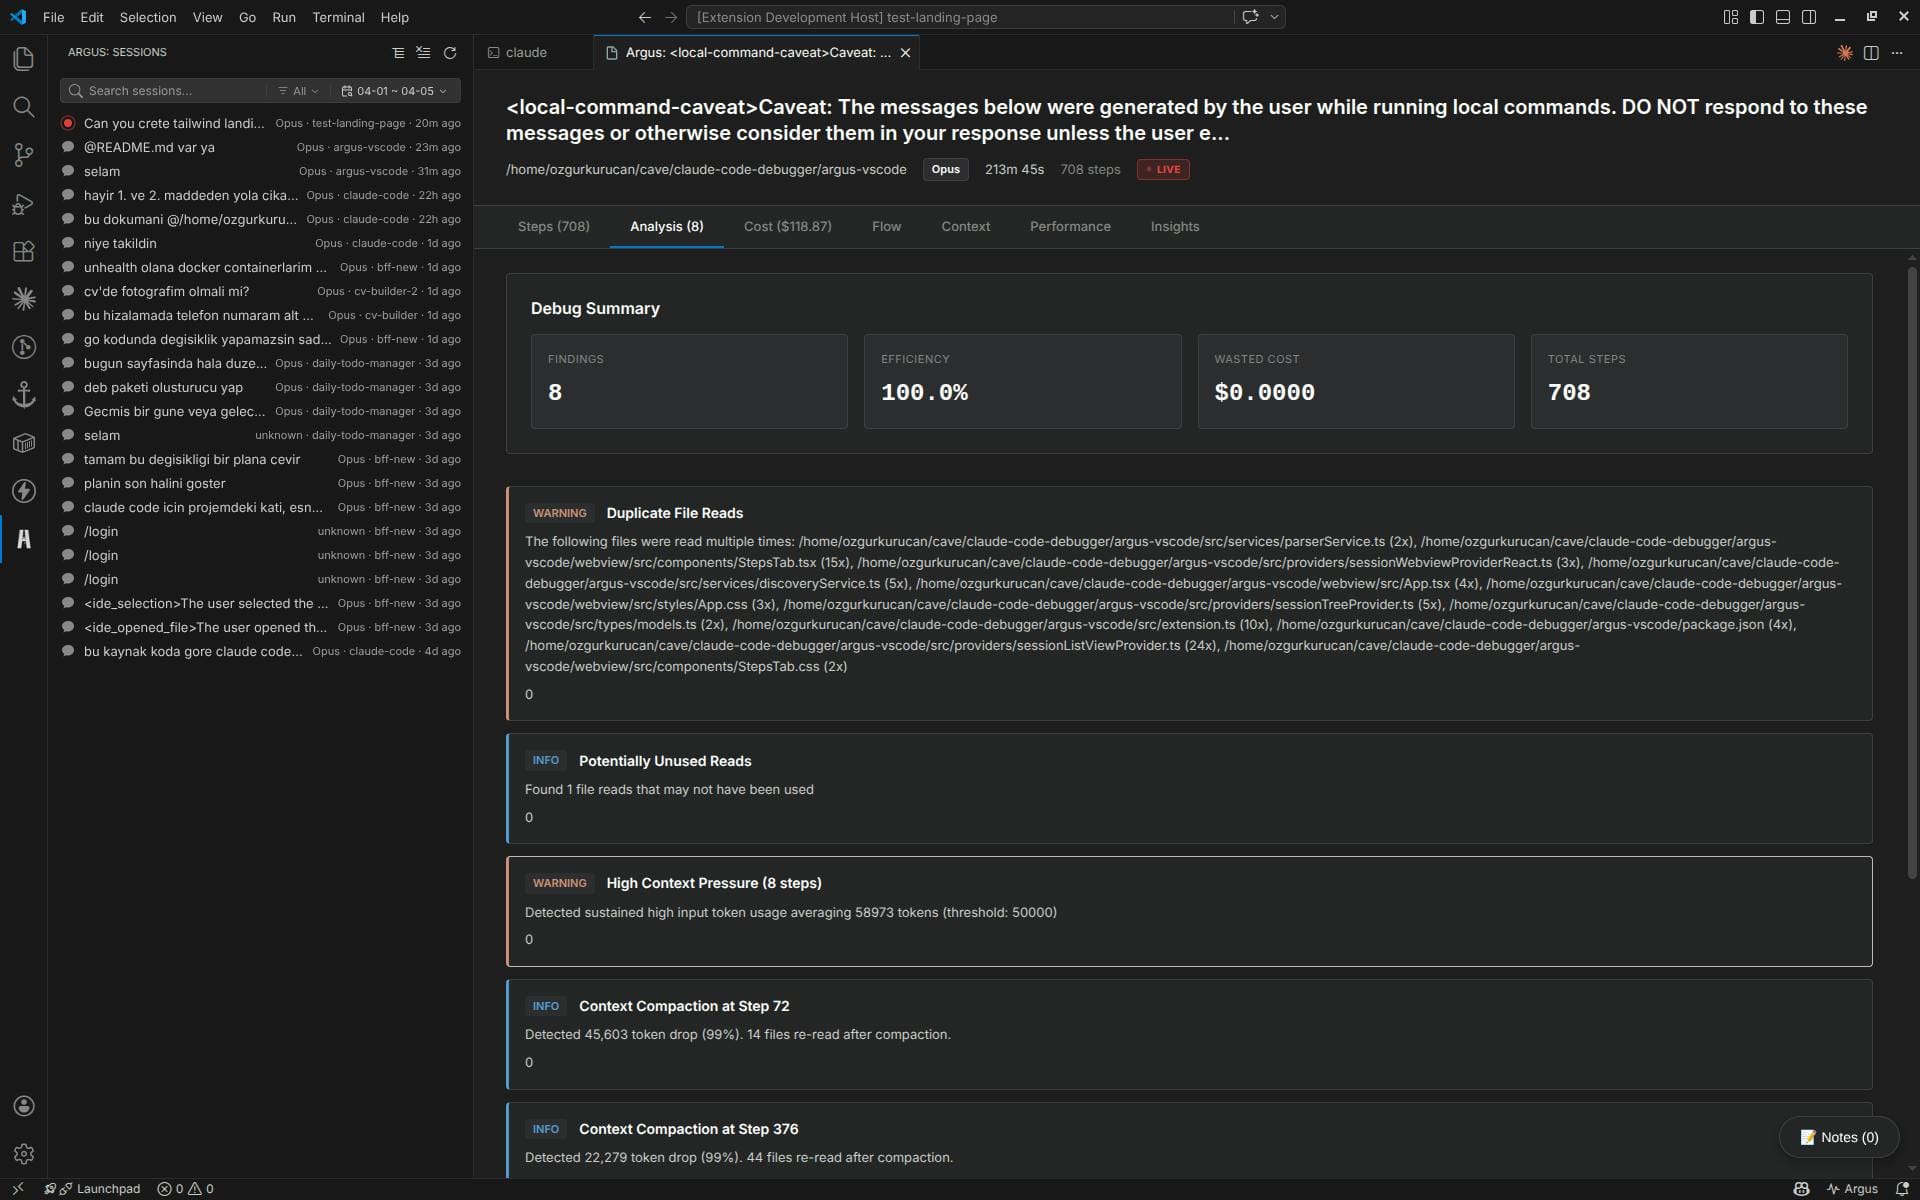
That makes Claude Code’s transcript files unusually valuable. They are not just logs for forensic curiosity. They contain the sequence of behavior: which tools were called, which files were read, which commands failed, when subagents were spawned, where token usage accumulated, how caching behaved, and whether the session was drifting toward compaction. Argus’s core move is to make that sequence visible inside the editor instead of leaving it as JSONL archaeology.
The HackerNoon article highlights three concrete pain points: retry loops, context waste, and cost uncertainty. Argus’s own positioning goes further, with screens for steps, analysis, cost, performance, and flow. The extension advertises duplicate-read detection, retry-loop detection, optimization findings, per-step token and dollar breakdown, cache attribution, efficiency scoring, wasted-cost analysis, and an interactive dependency graph showing how files and actions relate across the run.
That is exactly the kind of instrumentation developers use everywhere else. We do not debug production systems by staring at the final HTTP response and guessing. We use traces, spans, logs, metrics, flame graphs, profiling output, CI history, and database query plans. Coding agents need the same treatment. A Claude session that reads a broad directory tree, calls an MCP server that returns a giant blob, fails a shell command four times, then asks a subagent to rediscover the same context is not “creative.” It is an inefficient distributed system with a chat interface.
Local observability is useful, but it is not governance
The local-first design is a practical advantage. Argus does not need to start as a hosted SaaS that ingests proprietary code traces. It can parse the logs Claude Code already writes and show them where developers already work. For individual engineers, that reduces friction. Install the extension, watch a real run, and you can immediately see whether the agent is reading intelligently or just spraying context into the window.
But teams should not confuse transcript visibility with policy enforcement. A viewer can show that an agent called the wrong tool after the fact. It does not inherently stop the tool call. It can reveal that a transcript includes sensitive code, prompts, internal URLs, production telemetry, or vulnerability details. It does not magically make those traces safe to store, share, or upload. The transcript is useful because it is sensitive. Treat it like developer telemetry, not like a harmless UI cache.
That means organizations need a layered posture. Use local/session observability to debug behavior. Use first-party usage metrics for durable reporting and cost attribution. Use tool permissions, MCP scoping, sandboxing, CI gates, approval prompts, and audit retention for governance. If a team later centralizes these traces, it should make deliberate decisions about redaction, retention, access control, and whether prompts or source snippets are allowed to leave developer machines.
The most important practitioner move is not “install Argus and admire the graph.” It is to use the graph to change the workflow. If you see duplicate reads, add project conventions or targeted retrieval paths so every session does not rediscover the same facts. If you see repeated failed Bash calls, tighten the prompt or permissions around command execution. If an MCP server returns too much context, narrow the tool output or split the server interface into smaller calls. If compaction happens before the useful work starts, break the task into smaller units or seed only the context the agent actually needs.
This also changes how teams should evaluate coding agents. The old comparison was model-centric: which assistant writes the best patch from a prompt? The operating comparison is harsher: which runtime lets you see tool calls, bound authority, attribute cost, inspect context churn, debug failure loops, and connect live systems without turning every integration into a data-leak lottery? Claude Code, Codex, Copilot, Gemini CLI, Qwen Code, Cursor, and internal agents are all heading toward that battlefield. The winner is not just the model with the cleanest demo. It is the stack whose failures can be explained and fixed.
Agent cost is a software-quality signal
The cost angle is easy to trivialize as finance whining. It is not. Cost is often a proxy for bad agent ergonomics. A session that burns unnecessary tokens may be rereading files, calling tools too broadly, using a sloppy MCP connector, spawning redundant subagents, or carrying stale memories that pollute every turn. Lowering cost is not only about saving money. It often makes the output better because the agent spends less of its context budget on noise.
That is why Argus pairs well with Claude Code’s native /usage trajectory. Native usage can tell you where the runtime thinks cost came from — skills, subagents, plugins, MCP servers, large session files, cache creation, and entrypoints. A transcript debugger can show the sequence that caused the cost. One is accounting; the other is a profiler. Mature teams will need both.
A practical rollout starts small. Pick a low-risk repository and observe one real Claude Code task. Look for repeated file reads, failed tool loops, broad WebFetches, chatty MCP calls, premature compaction, and subagent fan-out that does not produce better evidence. Then change one thing: narrow the MCP tool, add a readme section the agent can target, split the task, reduce tool permissions, or adjust the command. Run again and compare the trace and /usage output. That is how agent optimization becomes engineering instead of folklore.
Argus is early, but it points at the correct abstraction: the agent session debugger. Developers do not need another black-box assistant with a prettier prompt box. They need to see what the agent did, what it cost, where it got lost, and which parts of the workflow deserve constraints. Once agents can spawn subagents, call MCP servers, compact context, and burn real money while you make coffee, “monitor, analyze, and manage” is not enterprise theater. It is table stakes.
Sources: HackerNoon, Argus GitHub repository, Argus VS Code Marketplace listing, Claude Code changelog, Claude Code monitoring usage docs