The LLM Leaderboard Is Becoming a Price-Performance Chart

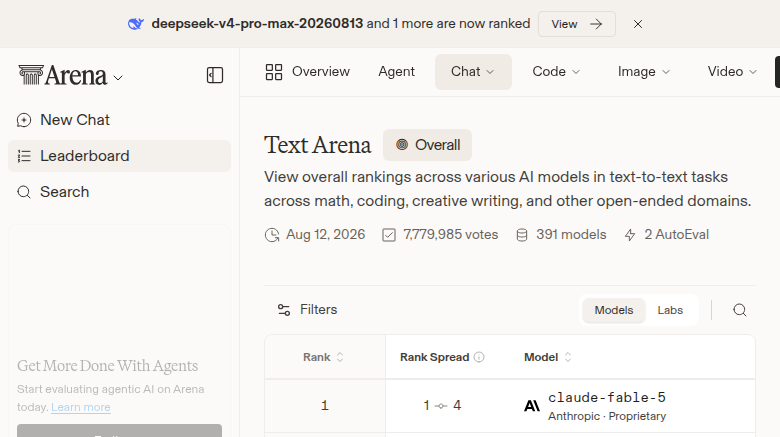
The most useful movement in this week’s model rankings happened nowhere near first place. Arena’s preference table did not budge, Anthropic still holds seven of its top eight slots, and OpenRouter’s five busiest models stayed in the same order. The signal is lower down: Gemini 3.6 Flash climbed past a free Nvidia endpoint, while OpenAI’s GPT-5.6 Terra edged past Claude Sonnet 4.6 after a price cut.
That is not a sudden verdict on which lab builds the smartest model. It is evidence that production buyers are getting more disciplined about buying enough intelligence. The leaderboard increasingly looks less like a beauty contest and more like a messy, real-world price-performance chart.
A paid Flash model just passed “free”
OpenRouter’s displayed weekly volume for Gemini 3.6 Flash rose from 2.32 trillion to 2.46 trillion tokens, moving it from ninth to eighth. Nvidia’s Nemotron 3 Ultra free endpoint moved the other way, falling from 2.36 trillion to 2.24 trillion tokens and dropping to ninth. At the lower end of the top 20, GPT-5.6 Terra increased from 819 billion to 841 billion tokens, enough to pass Claude Sonnet 4.6, which declined from 840 billion to 823 billion.
One-place swaps are normally leaderboard trivia. These two are more revealing because both winners are sold as economical working models rather than maximum-capability flagships. Google prices Gemini 3.6 Flash at $1.50 per million input tokens and $7.50 per million output tokens. OpenAI calls Terra the balanced GPT-5.6 tier and cut its price by 20% on July 30. Customers appear to be responding to the same proposition from two vendors: keep most of the capability, reduce the bill and the waiting.
The Nemotron comparison is especially instructive. Free inference is a formidable acquisition tactic, but “free tokens” and “free completed work” are not the same product. An endpoint that needs a retry, emits a longer answer, stalls during a tool loop, or requires an engineer to repair its output can cost more than a paid model that finishes correctly on the first pass. In agentic systems, the meaningful denominator is not tokens. It is verified outcomes.
Google’s own numbers make that pitch explicit. The company says 3.6 Flash uses 17% fewer output tokens than 3.5 Flash on the Artificial Analysis Index and up to 65% fewer on DeepSWE. It also reports a jump from 37% to 49% on DeepSWE, from 49.7% to 63.9% on MLE Bench, and from 78.4% to 83.0% on OSWorld-Verified. Those are vendor benchmarks, not invoices from your workload, but they point to the metric vendors now want buyers to notice: useful work per generated token.
The preference leaderboard is a necessary brake
Arena tells a conspicuously different story. Its extracted overall top 20 was identical to the previous day: Claude Fable 5 remained first, Anthropic occupied seven of the top eight places, and Gemini 3.6 Flash stayed fifteenth. Arena’s current client-rendered table did not expose reliable Elo or vote counts, so inventing precision would be worse than leaving those fields blank.
The disagreement is useful. Arena asks which answer people prefer in a head-to-head comparison. OpenRouter measures prompt and completion tokens flowing through its platform. Preference can reveal perceived answer quality; traffic reflects a mix of quality, price, latency, promotions, defaults, capacity and customer concentration. A model can win more blind comparisons and still lose production traffic. It can also generate more traffic merely because an application sends it huge contexts or verbose completions.
There is another measurement trap: OpenRouter says providers report counts using their own tokenizers. A trillion Gemini tokens is not guaranteed to represent exactly the same quantity of text or compute as a trillion Claude, GPT or DeepSeek tokens. The chart is a useful adoption indicator, not an audited market-share table. DeepSeek V4 Flash 0731 remaining first at 10 trillion displayed tokens—up from 9.39 trillion in the prior snapshot—is a strong sign of demand, but not proof that it handled ten times as many successful tasks as a model showing one trillion.
That distinction matters because rankings invite a lazy architecture decision: take the highest model your budget permits and call the selection process done. The two tables together argue for the opposite. Human preference and production economics are separate axes. Your routing layer should treat them that way.
Benchmark the workflow, not the answer
Practitioners should respond to this movement with a routing experiment, not a migration announcement. Build a representative replay set and run it against Gemini 3.6 Flash, Terra, your incumbent model and one cheap fallback. Record task success, p95 latency, total input and output tokens, tool-call count, retry rate and human correction time. For coding agents, add acceptance-criteria coverage, test quality and diff churn. A green CI run can still conceal a model that quietly skipped part of the contract.
Community reports help identify what to test, even when they cannot settle the ranking. Discussion around Gemini 3.6 Flash has praised speed and price while questioning whether intelligence improved proportionally; Hacker News commenters also focused on availability during coding sessions. Terra users have described a sensible division of labor—Terra Medium for routine application work, a heavier model for architecture and difficult refactors—but one reported audit said Terra High omitted roughly 30% of explicit acceptance criteria in a complex plan. These anecdotes are not controlled evaluations. They are excellent candidates for failure-mode tests.
Run those tests through the same provider path you expect to use in production. A laboratory-quality result from a direct API is little comfort if your actual gateway throttles, changes tool-call behavior or cannot supply capacity during peak hours. Likewise, evaluate complete workflows rather than single prompts. A fast first response that triggers three repair turns is not fast.
The practical deployment pattern is a portfolio. Route routine extraction, classification and bounded code edits to a fast mid-tier model; escalate ambiguous planning, security-sensitive changes and stubborn failures to a stronger tier; keep a fallback from a different provider for capacity incidents. Re-run the suite when prices, model versions or provider defaults change. A leaderboard snapshot is a trigger for evaluation, not a substitute for one.
There is a broader market shift underneath this week’s small rank changes. Vendors are no longer competing only to maximize benchmark scores. They are competing to reduce how much expensive reasoning a workflow consumes before it reaches an acceptable result. Google’s output-token claims and OpenAI’s emphasis on Terra’s speed and cost point in the same direction, as does the continued dominance of efficient models in OpenRouter traffic.
The next genuinely useful public leaderboard will rank cost per verified outcome, with latency and reliability attached. We do not have that table yet. Until then, OpenRouter traffic is the closest public proxy for what developers are actually buying, while Arena provides a valuable check on what users prefer. Read together, this week’s verdict is clear: the market did not discover a new smartest model. It got slightly better at purchasing the right amount of intelligence.
Sources: OpenRouter Rankings, OpenRouter rankings dataset documentation, Google’s Gemini 3.6 Flash announcement, OpenAI’s GPT-5.6 launch, Hacker News discussion, Arena AI leaderboard